
TailorMade Information Technology Solutions Ltd
Influenza Dashboard
Other example pages: Over_AGE/AT RISK | Influenza Given | Other Clinical Categories
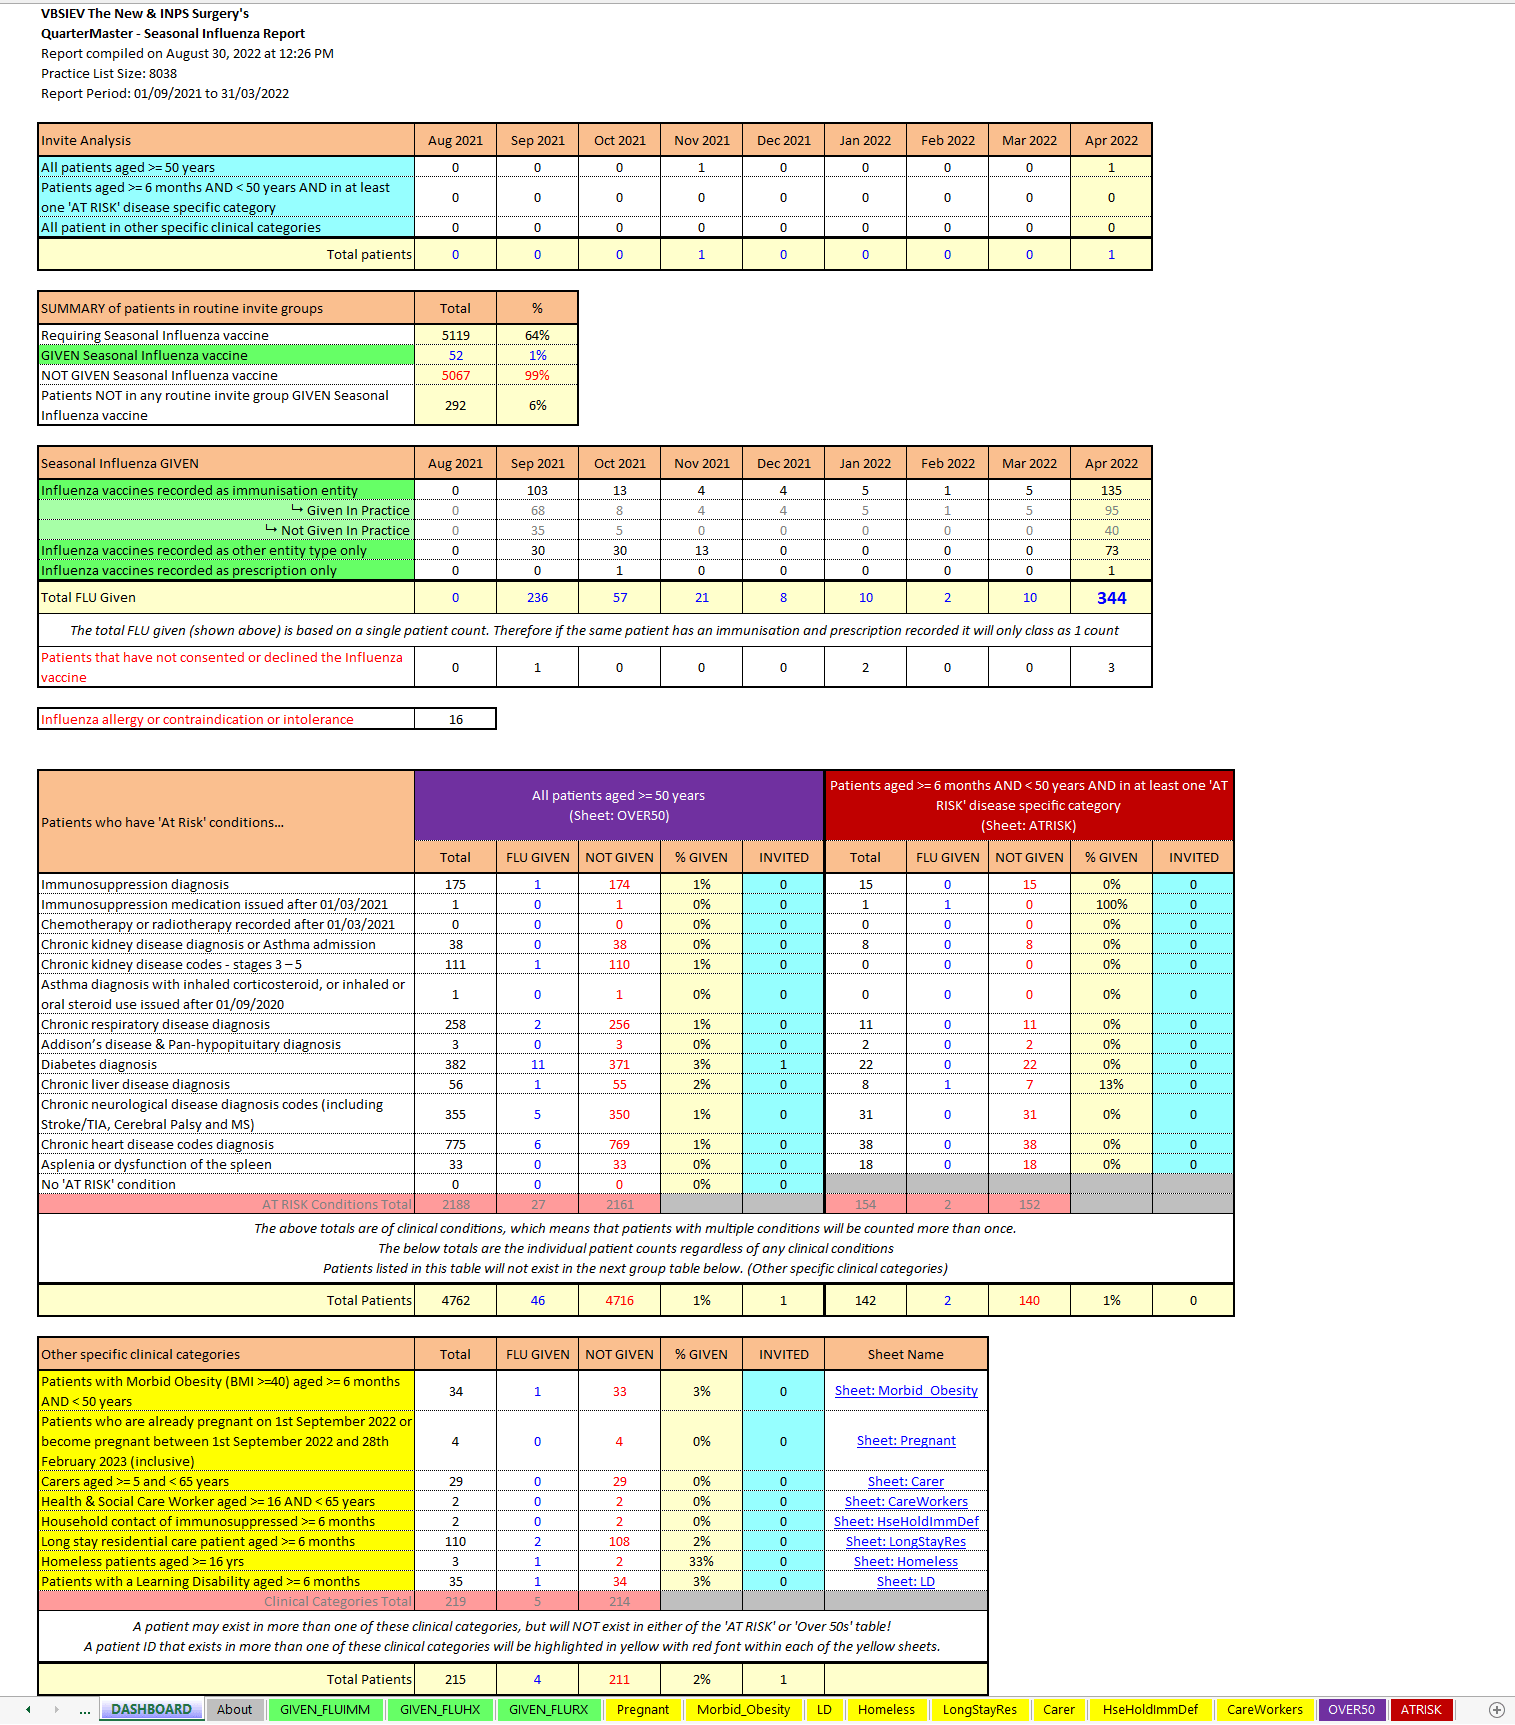
Seasonal Influenza Dashboard View
- The 1st table 'Invite Analysis' shows the Invite progress through the months, searching for READ2 codes within 9OX..
- The 2nd table 'Summary...' is a count of all the target patients (to be invited) based on the those in the 4th and 5th table. Showing those that have been given the Influenza vaccine and those that haven't.
- The 3rd tables shows a count of patients given the Influenza Vaccines and how it has been recorded.
- The 4th table details the 'AT RISK' groups for both the Over and Under 50yrs / 65yrs (This age can be defined in the report). Those Over the defined age also shows the risk groups, as you might want to priorities the invites.
- The 5th table provide a count of all the other clinical categories
Note: The sheet colours correspond to the colours in the Dashboard tables
Images below are based on 2022/23 report, but remain the same for 2023/24
Terms of Use
| Privacy Policy |
EULA |
FLA

")